
Picture this. A jewelry brand comes to me with a spreadsheet showing $18,000 of monthly ad spend, two dashboards, and a founder who cannot tell me which platform is actually paying for itself. Google says it drove 240 conversions. Meta says it drove 190. The store did 310 orders. The numbers don’t add up, so the founder does what most founders do: shifts budget toward whichever dashboard is flattering him that week.
That’s not a strategy. It’s a coin flip with extra steps.
The Google Ads vs Meta Ads for ecommerce question gets framed as a fight, and it isn’t one. The two platforms do different jobs at different points in the buying cycle, and the reason your reporting looks broken is that you’re measuring two different jobs with one number. This article covers the full picture: what the benchmark data actually says about cost and return on each platform, why the intent gap explains most of the gap in your results, how to split a budget without guessing, and how to prove which half of your spend is doing real work.
What the benchmark data says about Google Ads vs Meta Ads for ecommerce
Start with cost, because that’s where the two platforms look most different.
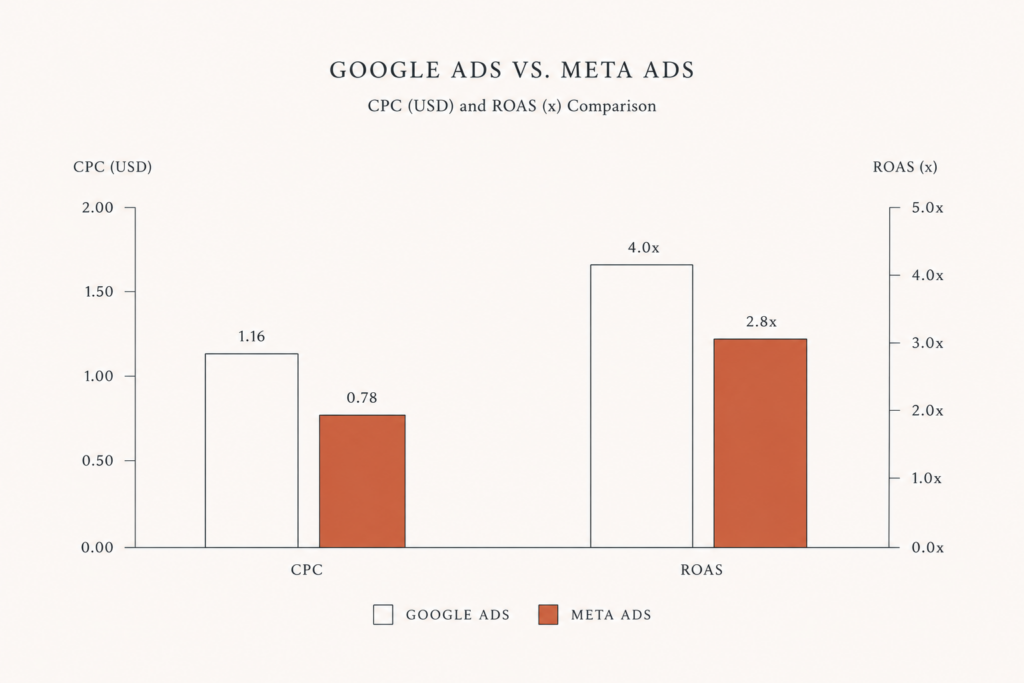
Google Ads averages around $5.26 CPC across all industries, but ecommerce specifically sits closer to $1.16, according to 2026 Google Ads cost benchmarks. Meta is cheaper per click in most verticals, with an average CPC near $0.78 and apparel down at roughly $0.45, based on Meta’s 2026 cost benchmarks.
So Meta wins. Except it doesn’t, because clicks are not the product. Orders are.
On return, the ordering flips. Industry benchmarks put ecommerce Google Ads around 4.0x ROAS against roughly 2.8x for Meta, and in fashion the split is wider still, with Google at about 4.07x and Meta’s median near 2.65x. Cheaper traffic, weaker return. That’s not a contradiction. That’s the whole story compressed into two numbers.
The takeaway: Meta sells you volume, Google sells you intent, and intent is what converts.
The intent gap is the real difference, not the platform
Here’s the thing: a person searching “1 carat lab grown diamond ring” has already done the hard part. They’ve decided they want the thing. They’ve probably compared three sites. The ad’s job is small, which is why it’s cheap to do well.
A person scrolling Instagram has decided nothing. Your ad interrupted a video of somebody’s dog.
The conversion data lands exactly where you’d expect it to. Google paid search converts around 2.0 to 3.0 percent for ecommerce, while cold Meta traffic sits near 1.1 percent, roughly a third of the rate. Same store. Same product. Same checkout. The only variable that changed was what the visitor already wanted before they arrived.
This is why “which platform is better” is the wrong question. Google Ads is a demand-capture channel. Meta is a demand-creation channel. If you only run Google, you’re harvesting a field nobody is planting. If you only run Meta, you’re planting a field nobody is harvesting.
The brands that get stuck are almost always the ones that judged a demand-creation channel by demand-capture metrics, then cut it, then watched branded search volume quietly fall off a cliff two months later.
How to actually split the budget
There’s no universal split, but there is a defensible starting point and a rule for moving off it.
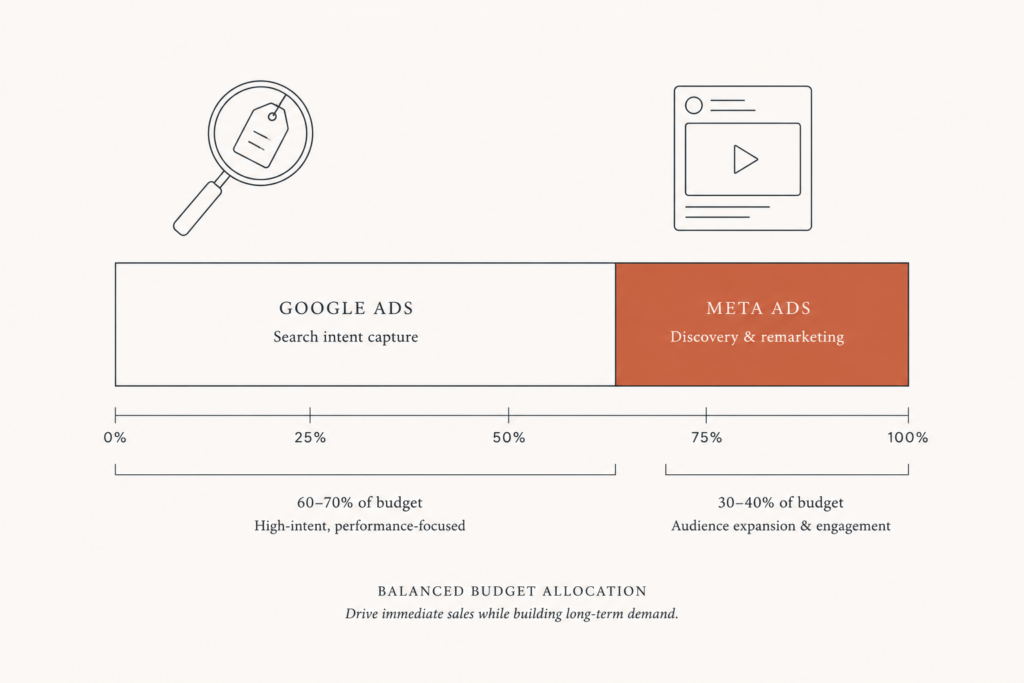
The common 2026 framing is a 70/30 lean toward Google, on the logic that you capture existing demand first and create new demand with what’s left. Other operators run closer to 60/40 in Meta’s favour, adjusted by blended ROAS. Both can be right. What decides it is where your growth is currently constrained.
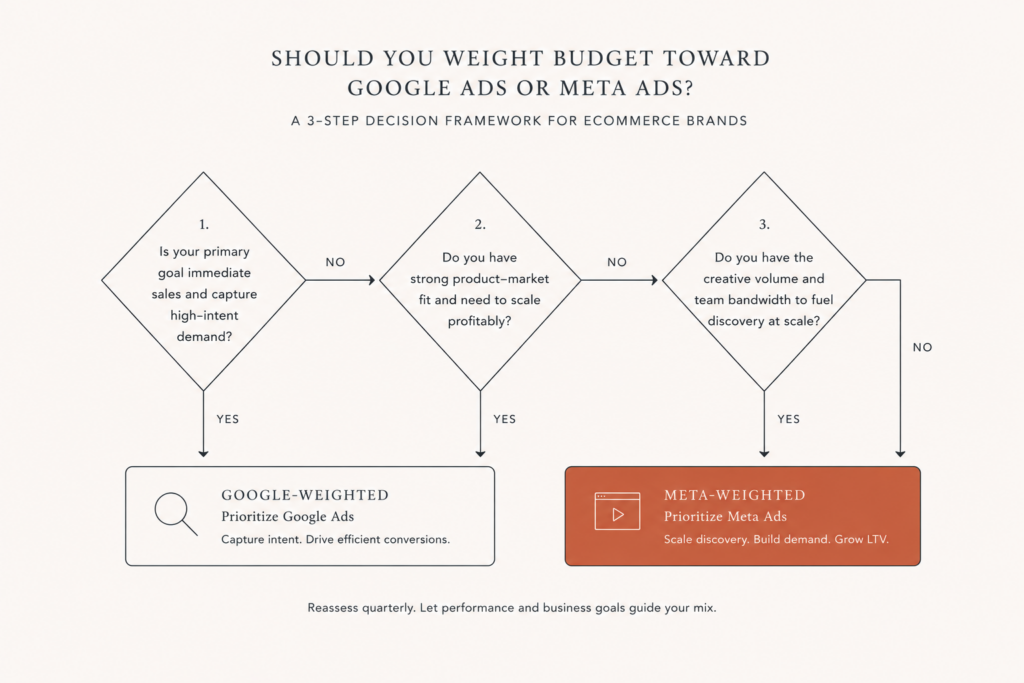
Use this as the decision rule:
- Pull your branded and non-branded search volume. If people are already searching for you and your category, and you’re not capturing all of it, you have a harvesting problem. Weight Google. There’s no cheaper revenue than demand that already exists.
- Check whether you’re impression-share-capped on Google. If you’re at 85 percent plus impression share on your money keywords, more Google budget buys you nothing but worse keywords. The ceiling is real. Move the delta to Meta.
- Look at your product’s explanation cost. A replacement phone charger sells itself in a search result. A $4,000 bespoke engagement ring needs to be seen, understood, and trusted before anyone types your name. High explanation cost pushes budget toward Meta.
- Check your creative capacity honestly. Meta costs are heavily creative-dependent, and brands running fresh performance creative see meaningfully lower CPMs than those running stale ads. If you can’t produce new creative every two weeks, Meta budget will decay whether you like it or not.
- Respect the floor. Below roughly $1,500 to $3,000 a month, Meta struggles to exit the learning phase. Spreading a small budget across two platforms to feel diversified usually just starves both.
Start at 70/30 toward Google if you’re demand-constrained. Start at 60/40 toward Meta if you’re impression-capped and creative-rich. Then let the measurement move you, not the dashboard.
Your dashboards are lying, and both of them know it
Back to that founder with 240 plus 190 conversions and 310 actual orders. That gap isn’t a bug in his setup. It’s the design.
Both platforms are graded by themselves. Meta claims a conversion if it showed someone an ad within its attribution window, and Google claims the same person off the branded search they typed because of the Meta ad. Double-counting isn’t an accident. It’s the business model.
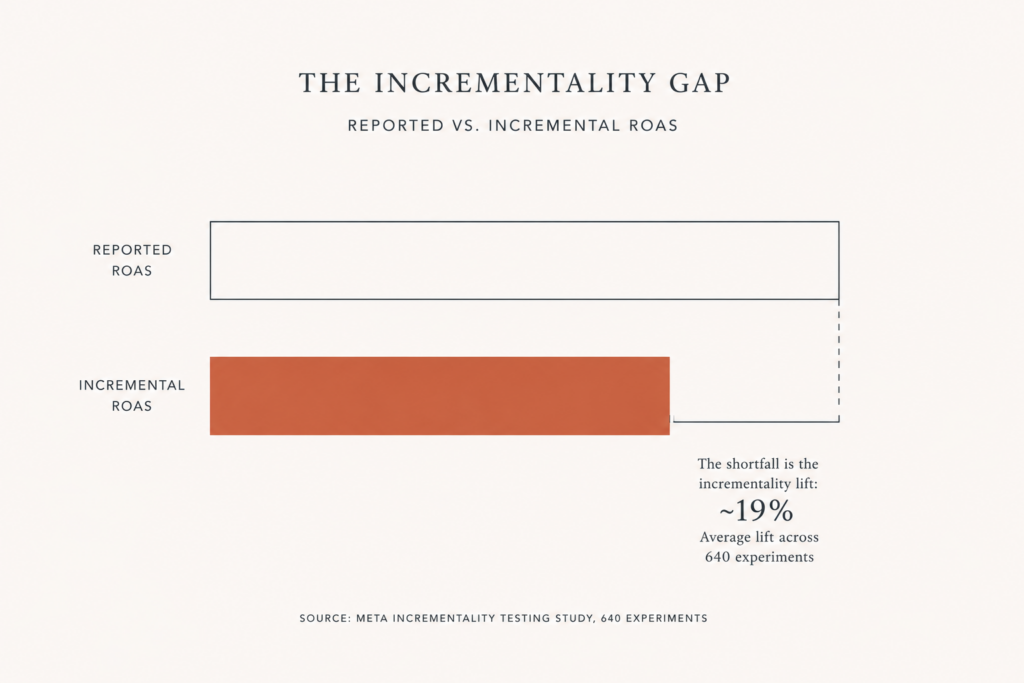
The correction is incrementality, not attribution. You pause a channel in a defined geography, hold a comparable geography as control, and measure what actually changed in total revenue. Analysis of 640 Meta incrementality experiments found an average lift near 19 percent, considerably below what platform-reported ROAS implies. If your incrementality factor comes back at 0.7, then a reported 3.0x is really a 2.1x, and every budget decision you made off the dashboard was made on a number that was 40 percent too generous.
Run the test before you rebalance. Then rebalance on the corrected number.
Two things make this actually possible. First, get your measurement layer honest: server-side tracking closes the gap that cookie loss and ad blockers open, which I’ve written about in GA4 server-side tracking. Second, accept that the platforms will never agree, and stop trying to make them, which is the argument in ecommerce attribution. Blended ROAS against total revenue is a cruder number than either dashboard offers. It’s also the only one that pays your rent.
What to fix before you spend another dollar on either
Most stores that think they have an ad problem have a feed problem, a speed problem, or a landing problem. Ads don’t fix any of those. Ads pay full retail to expose them.
Before you touch budget:
- Fix the feed. Google Shopping and Meta catalog ads both eat the same product data. A weak feed caps both channels at once. The Merchant Center Next post covers the specifics.
- Fix the speed. Every second of delay taxes paid traffic more than organic, because you paid for the click and then lost it. A sub-3s budget isn’t a vanity target. It’s margin protection.
- Fix the campaign structure. Broad Performance Max with no exclusions will happily spend your prospecting budget on people who were going to buy anyway. The structure that avoids this is in Performance Max for ecommerce and, for Shopify specifically, Google Ads campaign structure.
That’s not overhead. That’s the difference between buying revenue and renting traffic.
The bottom line on Google Ads vs Meta Ads for ecommerce
The question was never which platform wins. Google Ads harvests. Meta plants. A store that only harvests runs out of field, and a store that only plants never eats.
If your category has real search volume and you’re not capturing all of it, start Google-heavy at roughly 70/30 and fix your feed and structure before you scale. If you’re already impression-capped on Google and you can ship fresh creative every two weeks, push toward 60/40 Meta and accept that its reported ROAS needs an incrementality haircut before you trust it. Either way, run a geo holdout before you make a big move, and grade both channels against blended revenue rather than against their own homework.
If you’d rather have someone look at the measurement layer, the feed, and the store speed underneath your ad spend, reach out to Javaid Ahmad for a straightforward conversation about what’s actually leaking. No lengthy discovery calls, no vague proposals, just a clear answer on next steps. There’s a free store audit if you want a read before you commit to anything.
FAQ
Q: Is Google Ads better than Meta Ads for ecommerce? A: For direct response on products people already search for, yes, Google generally returns more per dollar, with ecommerce benchmarks around 4.0x ROAS versus roughly 2.8x on Meta. For products that need to be discovered or explained, Meta creates the demand that Google later captures. The channels grade differently because they do different jobs.
Q: What is a good ROAS for ecommerce on Google Ads and Meta Ads? A: Industry benchmarks put ecommerce Google Ads near 4.0x and Meta near 2.8x, with strong Meta accounts reaching 3.5x to 5.0x. Treat those as reference points, not targets. Your real target is whatever ROAS clears your contribution margin after platform over-reporting is corrected.
Q: How should I split my ad budget between Google and Meta? A: A 70/30 split toward Google is a reasonable default when you’re demand-constrained and not yet capturing your existing search volume. Shift toward 60/40 in Meta’s favour once you’re impression-share-capped on Google and you can sustain fresh creative. Move off the default based on incrementality results, not dashboard ROAS.
Q: Why do Google and Meta report more conversions than my store actually got? A: Each platform counts a conversion it believes it influenced within its own attribution window, so the same order can be claimed twice. Reconcile against total store revenue with blended ROAS, and use geo holdout tests to find each channel’s true incremental contribution.
Q: What is the minimum budget to run both platforms properly? A: Meta typically needs roughly $1,500 to $3,000 a month to exit the learning phase reliably, and a meaningful test window needs more. Below that, splitting spend across two platforms usually starves both. Pick the one that matches your demand situation and run it properly first.
Q: Do I need incrementality testing if I already use GA4? A: GA4 tells you what happened along a path. It doesn’t tell you what would have happened anyway. A geo holdout is the only cheap way to separate revenue your ads caused from revenue your ads simply witnessed.
Budget split is one question. Campaign structure, feed quality, and what to do when ROAS stalls are the rest, and they are collected in Google Ads.

Comments are reviewed before they appear, so yours will not show up straight away. Your email is never published.